When it rains cats and dogs, interactively
Interactive charts of rain and rainstorm warning signals patterns in Hong Kong
By Kenneth Wong in Data Storytelling
July 28, 2022
So I wrote a story about the history of rainfall and rainstorm warning signals issued by Hong Kong Observatory from 2012 to 2022. I thought it will be the end of the story.
Until I remember that people now always look for interactivity for charts.
So the story continues. I make a few twerks of my code to generate the plot and make an interactive version of it. The edits are mostly nudging the layout and resize the texts. Web charts are, in the end, a different territory from static charts.
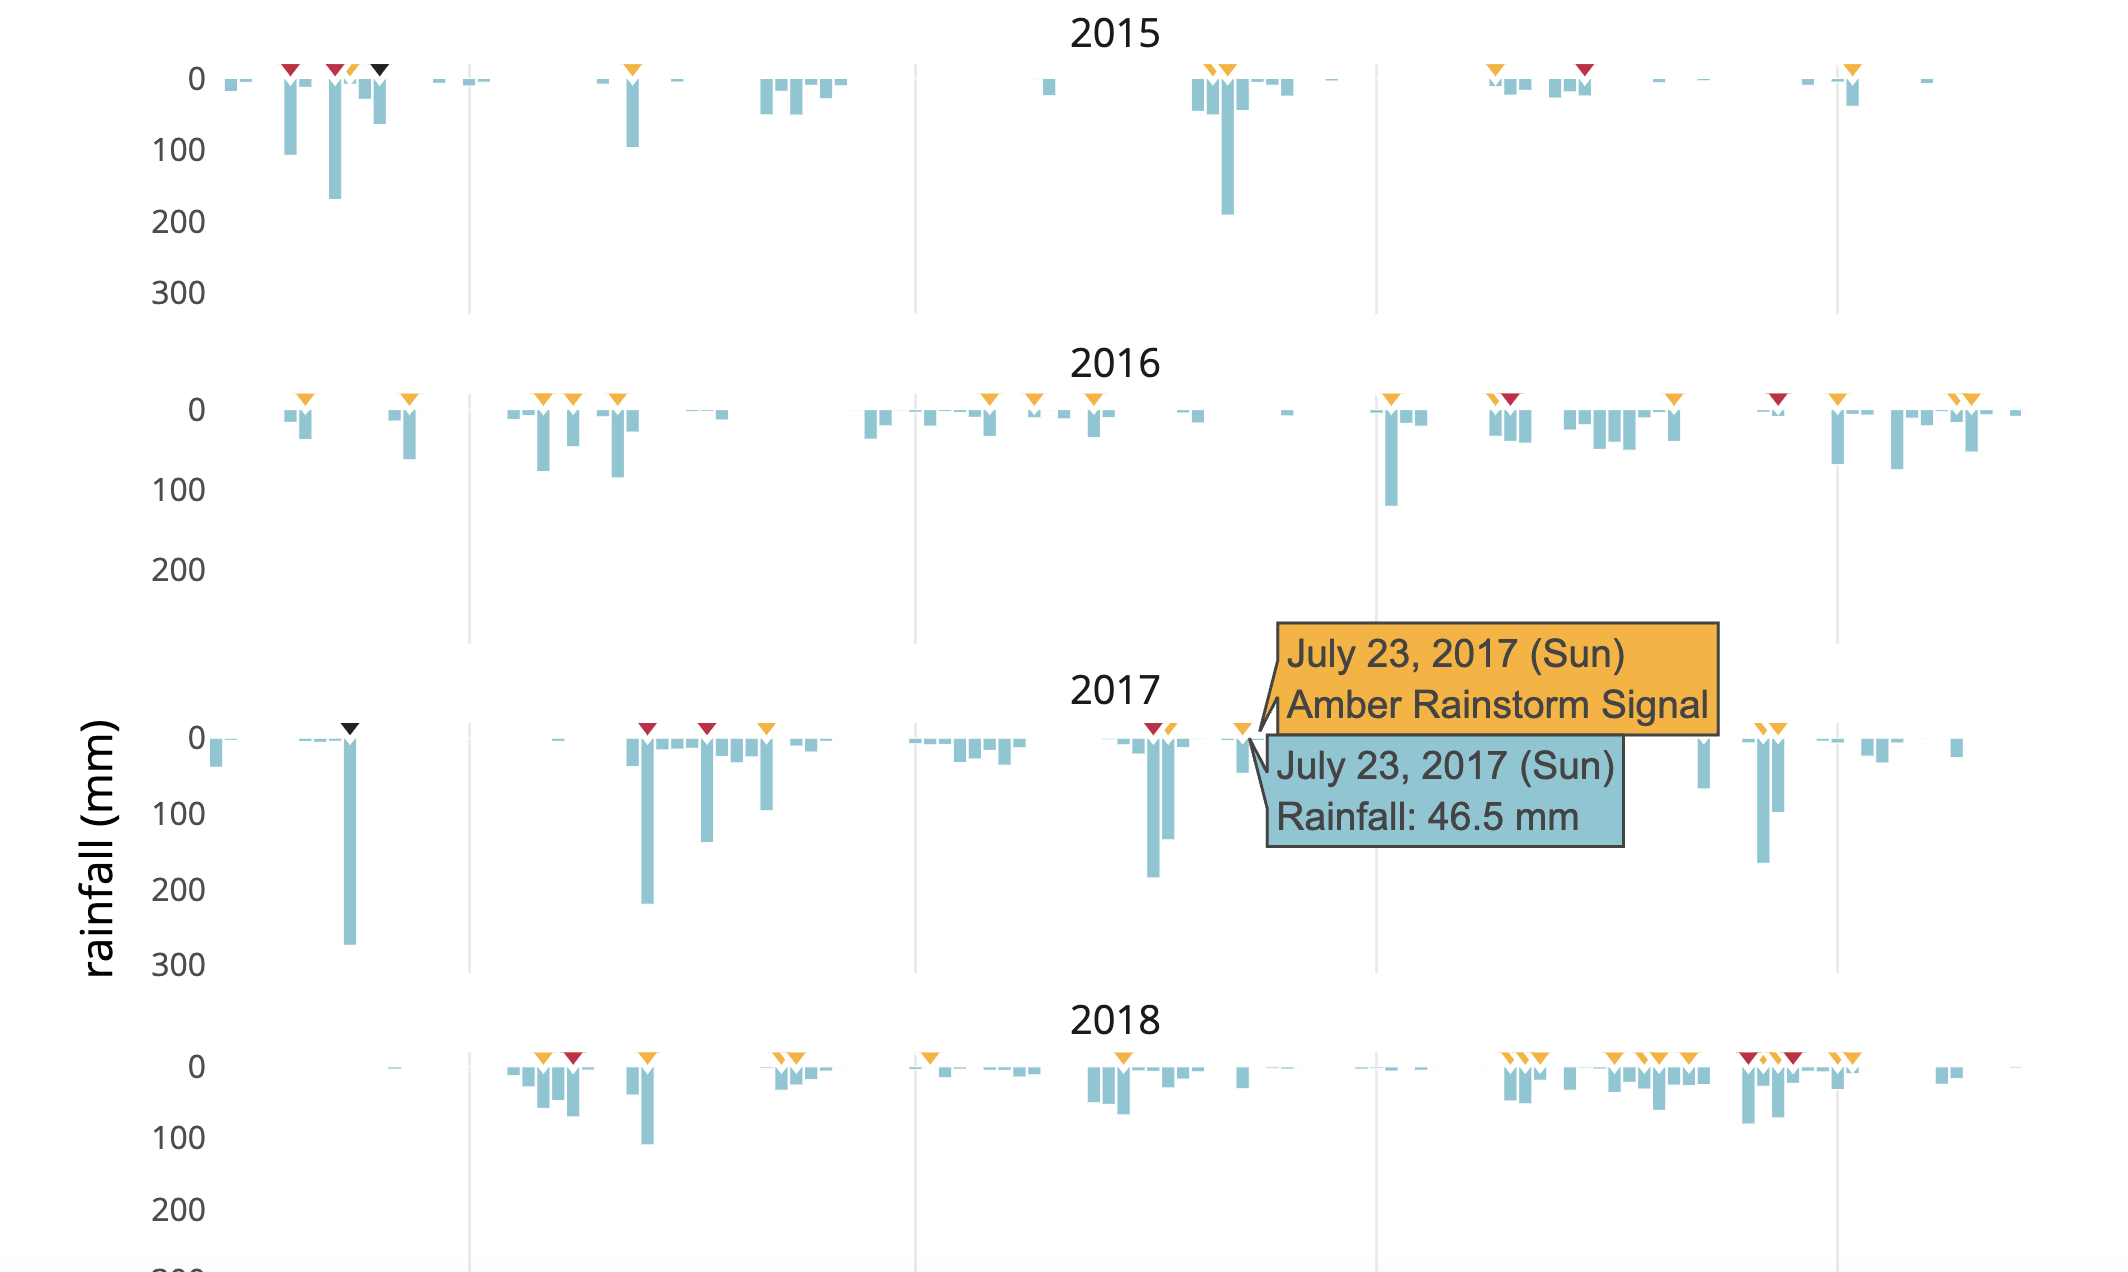
And here you go - interactive version of the rain and rainstorm warning signals patterns in Hong Kong from 2012 to 2022, with zooming enabled and details of rainfall volume added.