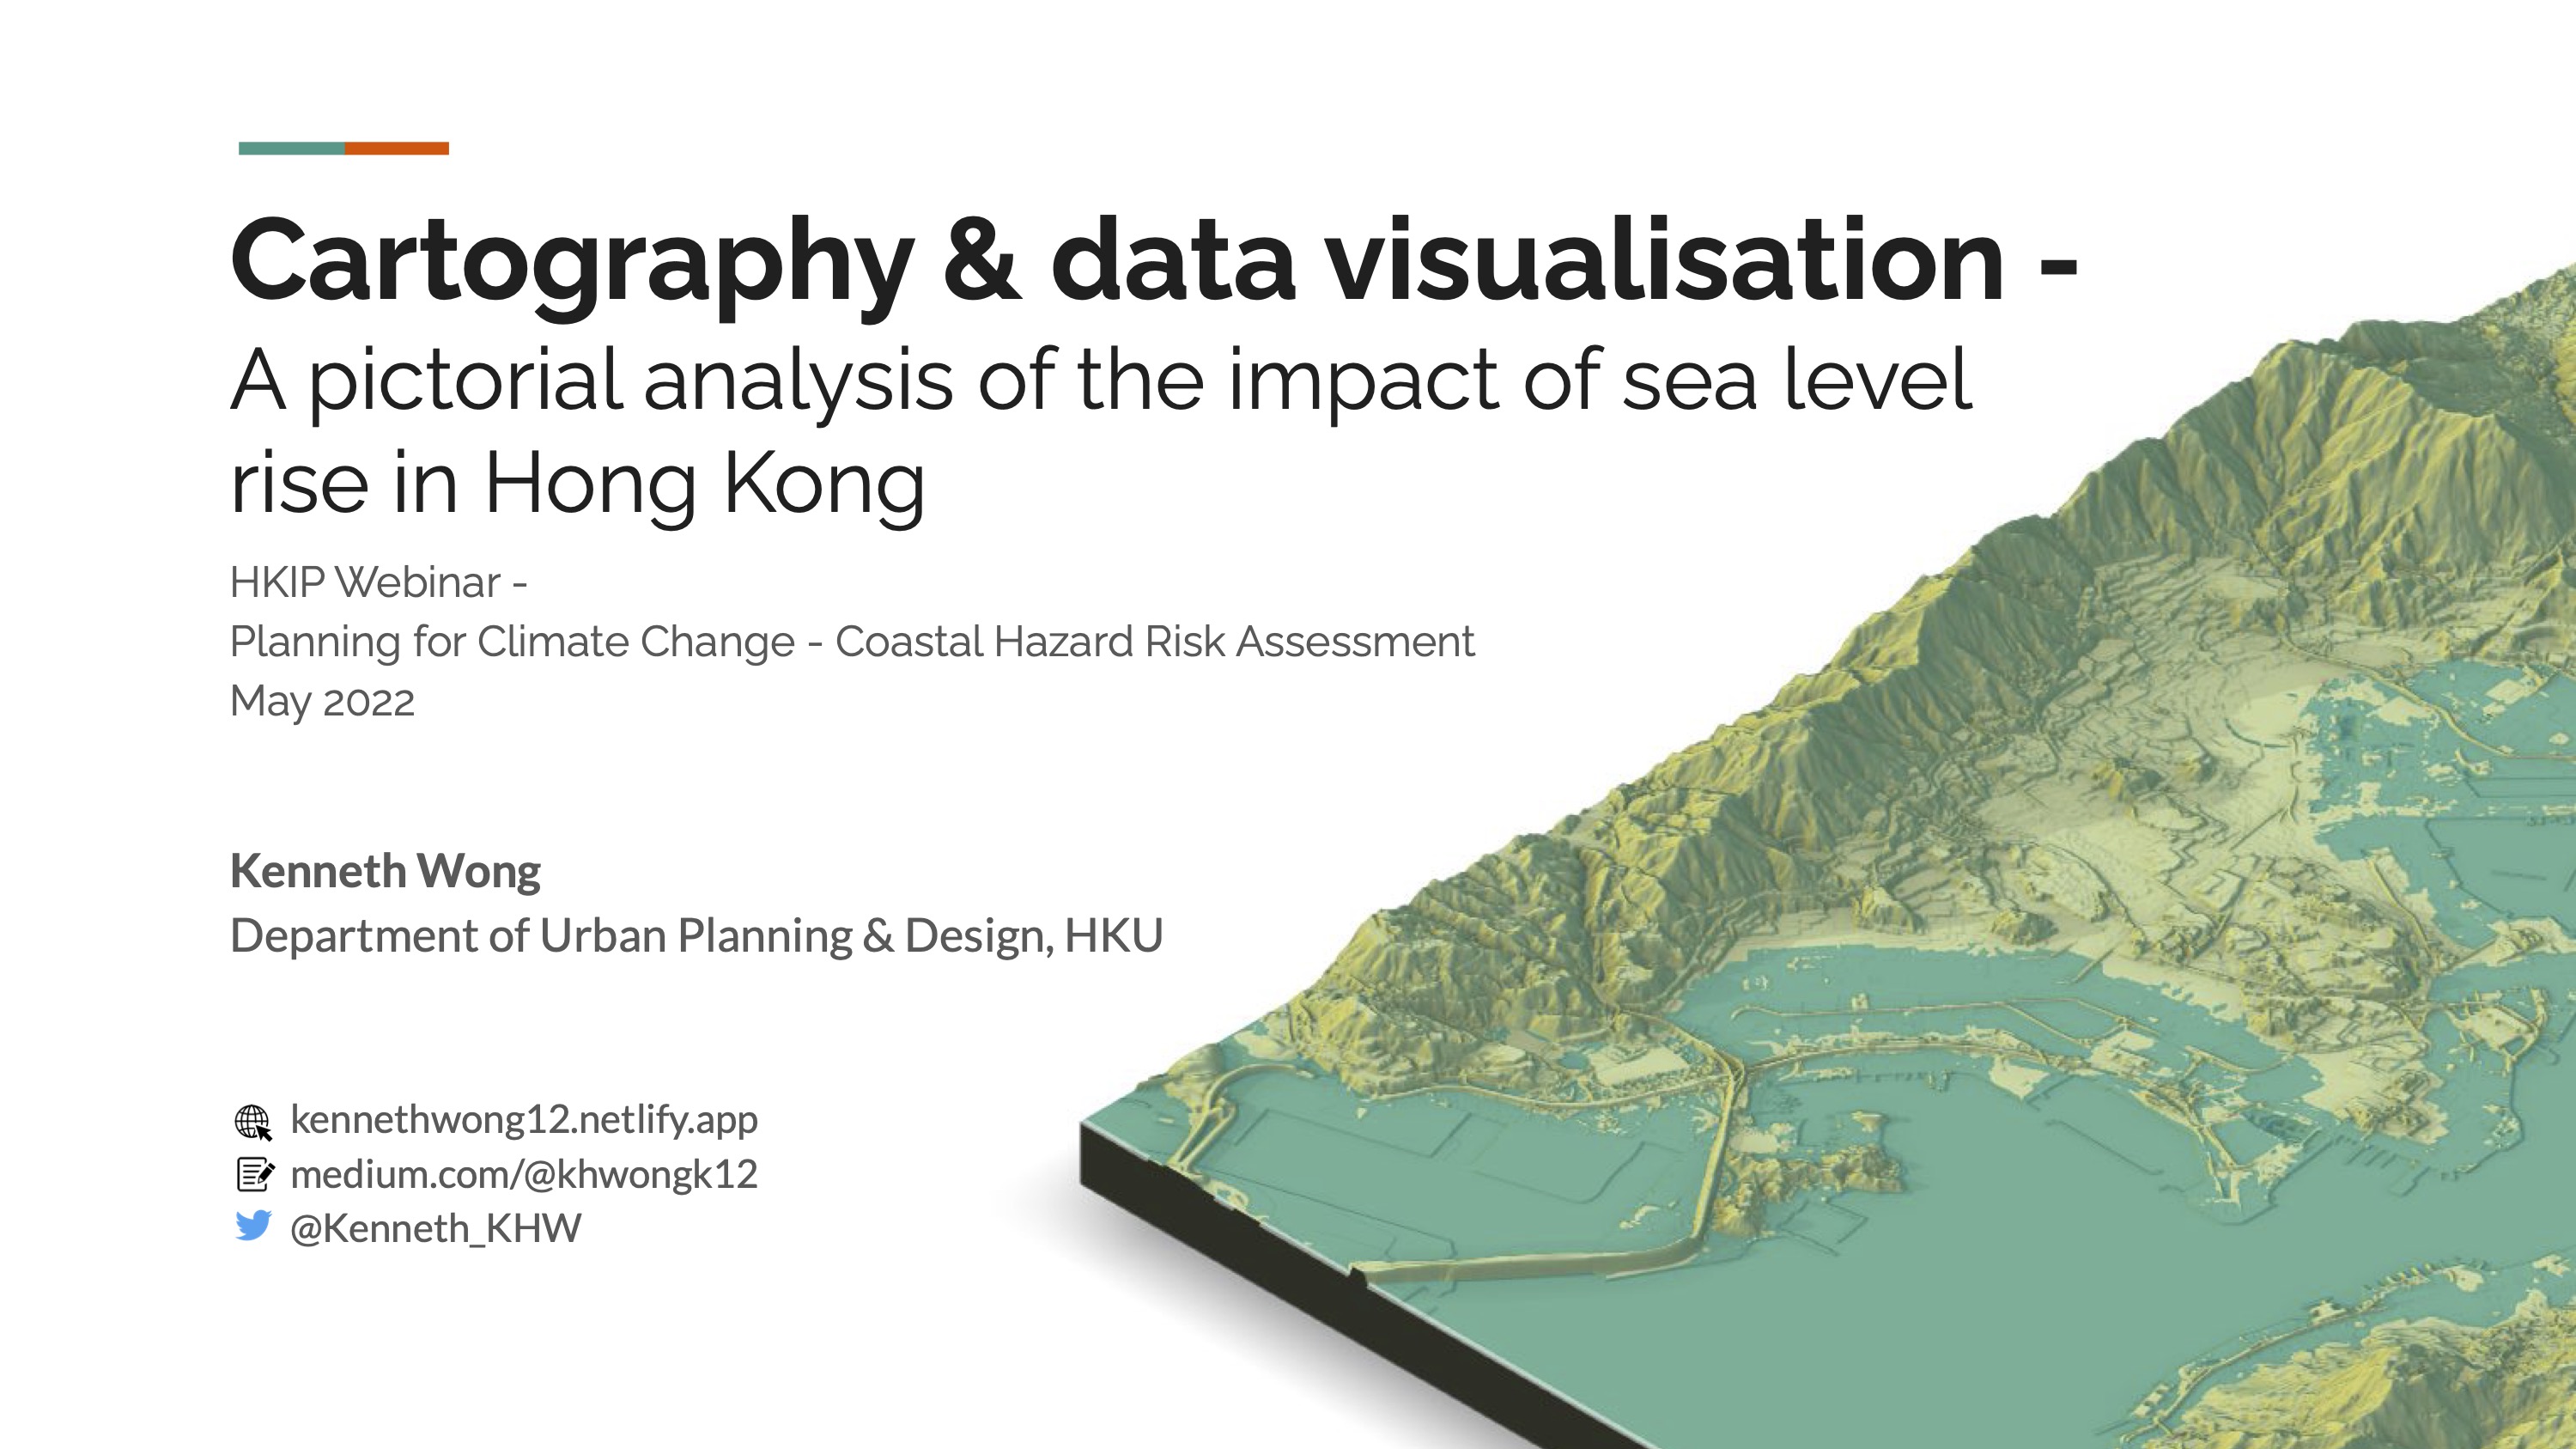
Cartography & data visualisation - A pictorial analysis of the impact of sea level rise in Hong Kong
By Kenneth Wong in seminar
May 23, 2022
Abstract
Sharing session of using data visualisation and cartography to understand and discuss sea level rise
Date
May 23, 2022
Location
Online
Event
This is a seminar organised by the Sustainability and Climate Change Working Group of the Community Planning Committee (CPC), Hong Kong Institute of Planners (HKIP). The seminar aims to unpack the ideas of climate change adaptation and town planning, particularly on coastal hazard risk assessment and “hazard mapping” as a tool for town planners and the community, and to spark discussions across the panel as well as with the audience.
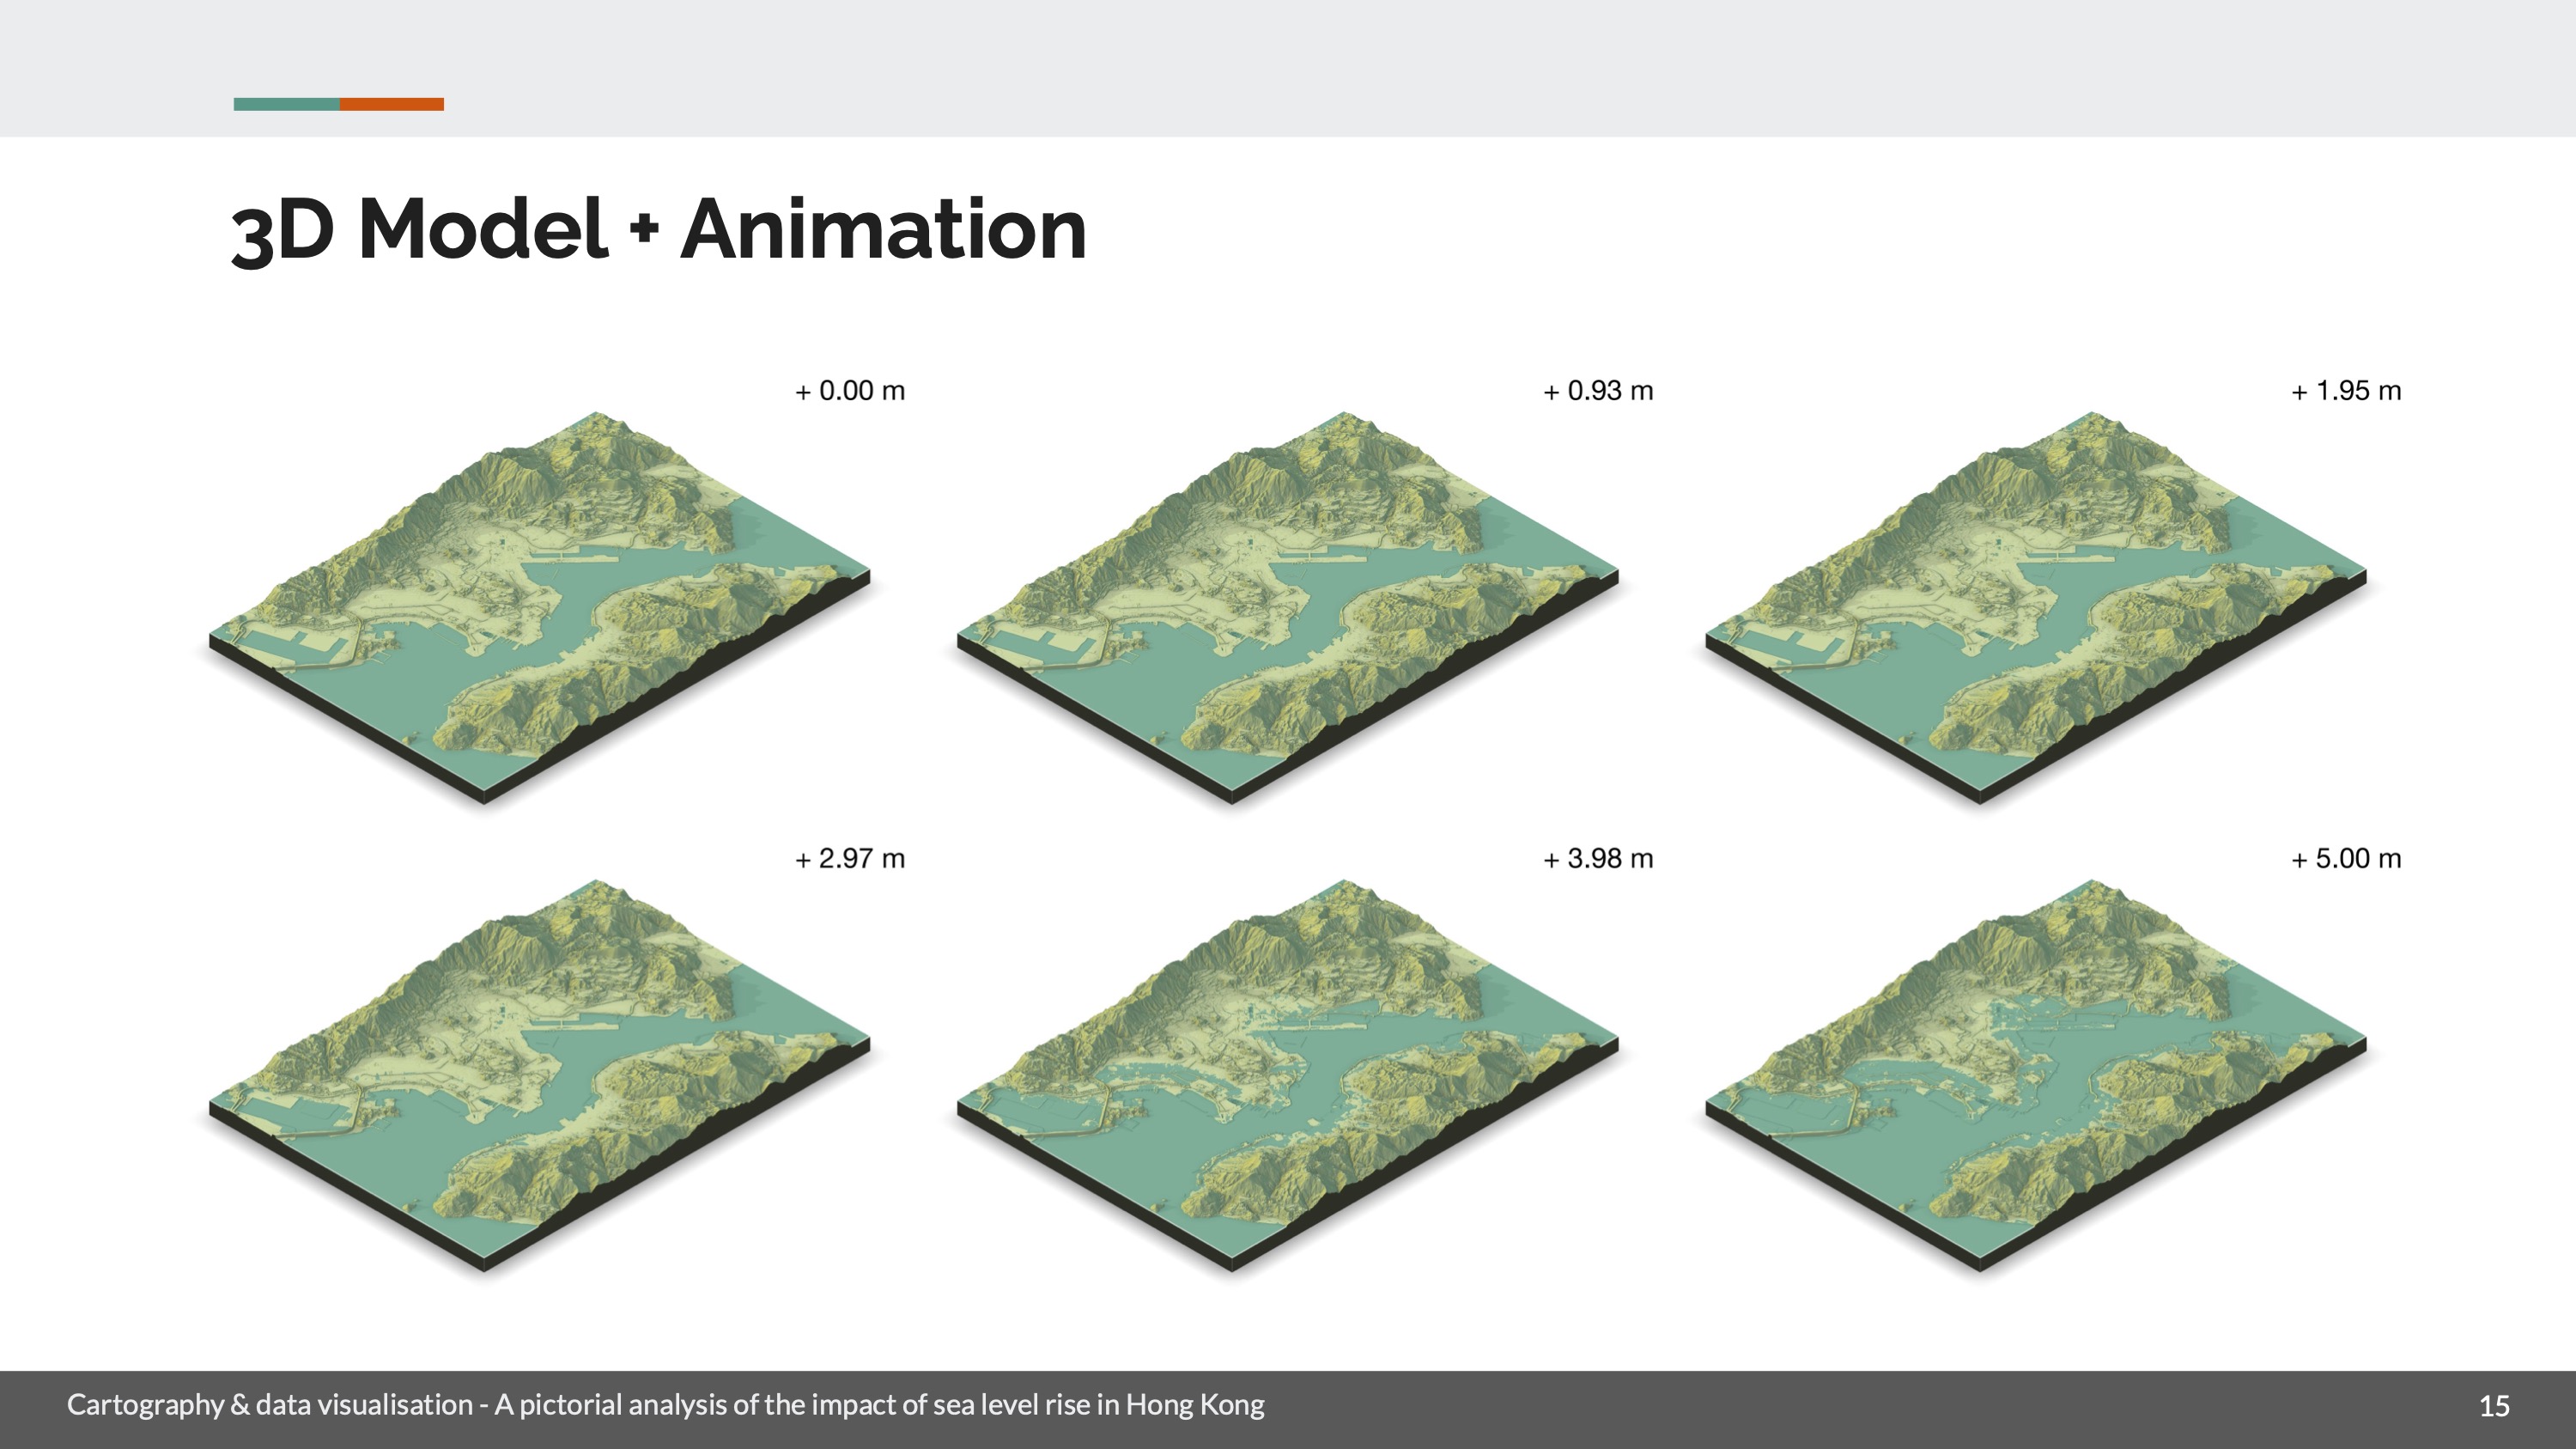
Using 3D rendering animation to show flooded area
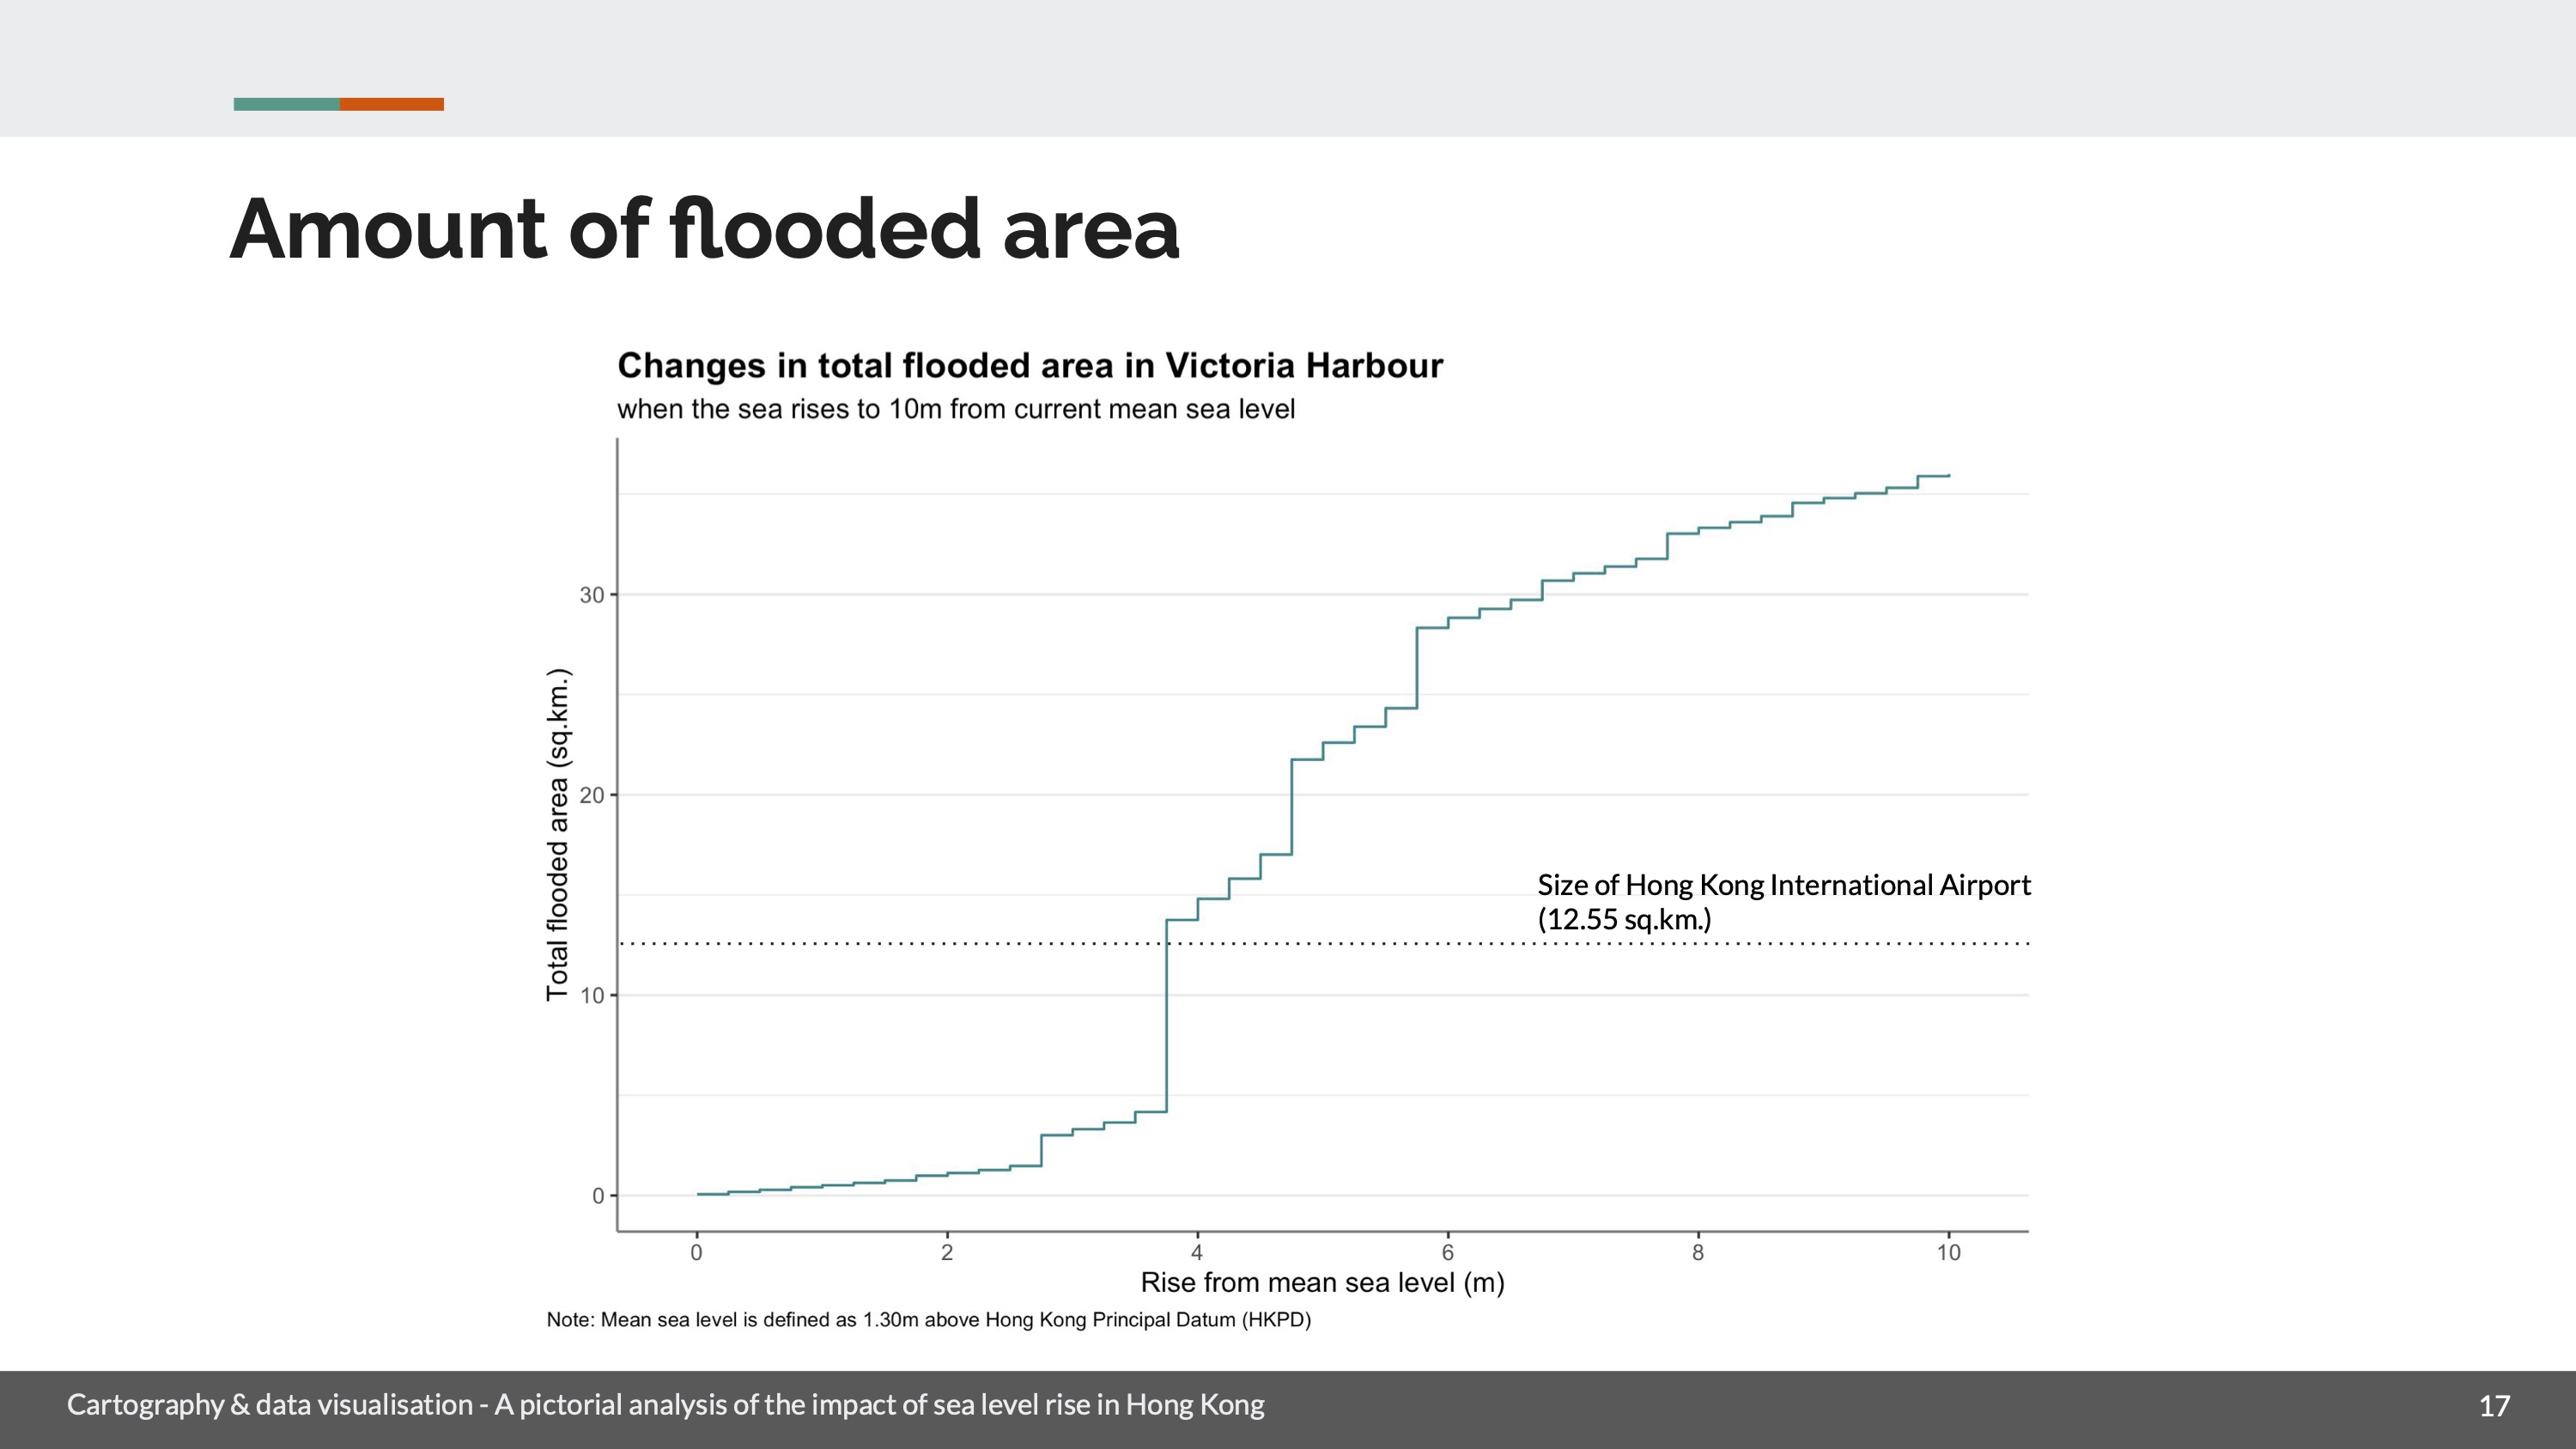
Chart showing cumulative flooded land area
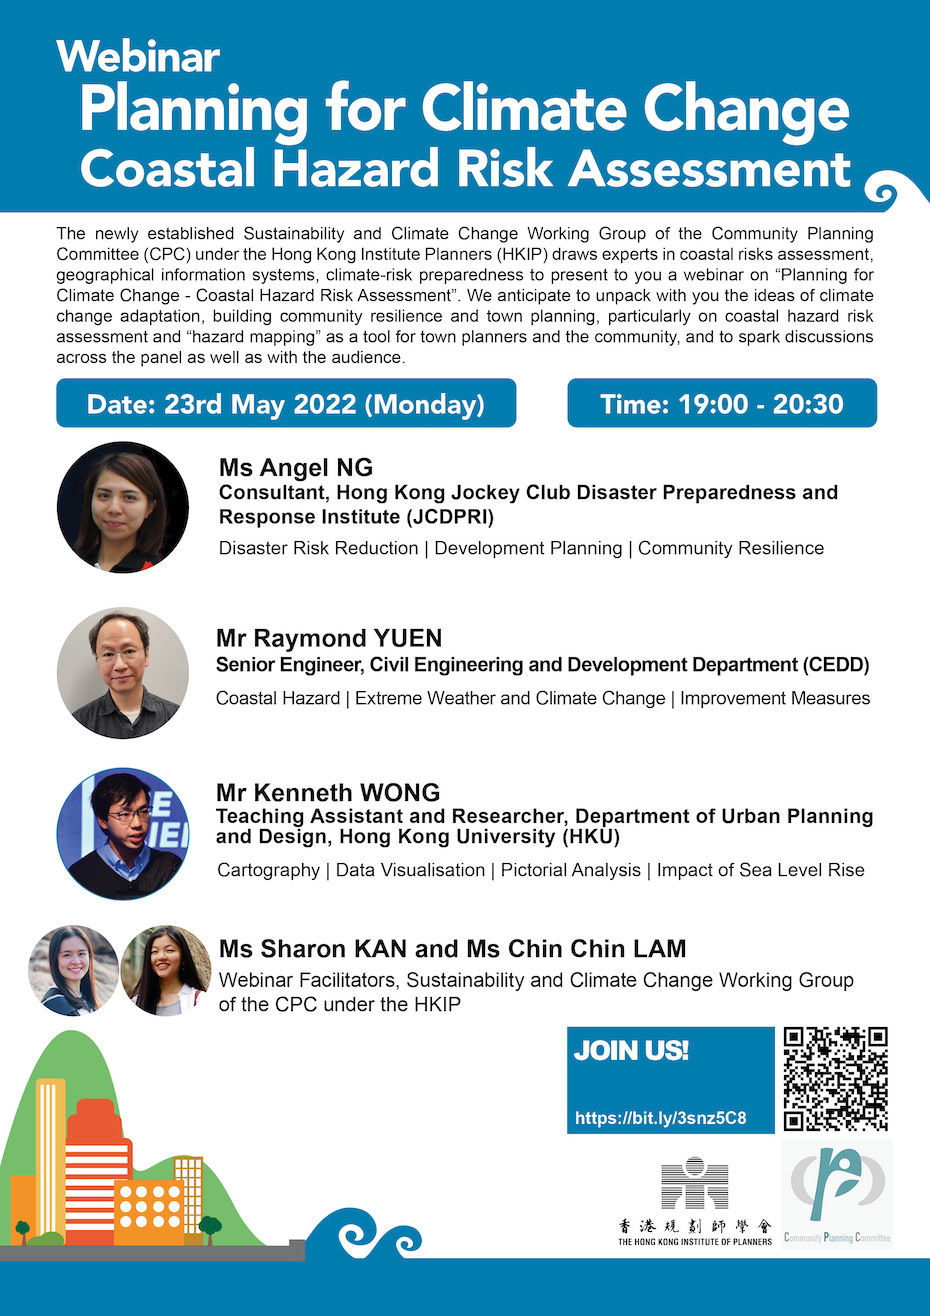
Webinar poster