Map Gallery
By Kenneth Wong in Cartography Data visualisation
March 20, 2022
What comes with urban analytics are mostly maps and charts. I always try to polish my products to make them look something better.
In many occassions, I create some one-off maps and charts for topics I find interesting and use it as a chance for me to practice cartography and data visualisations.
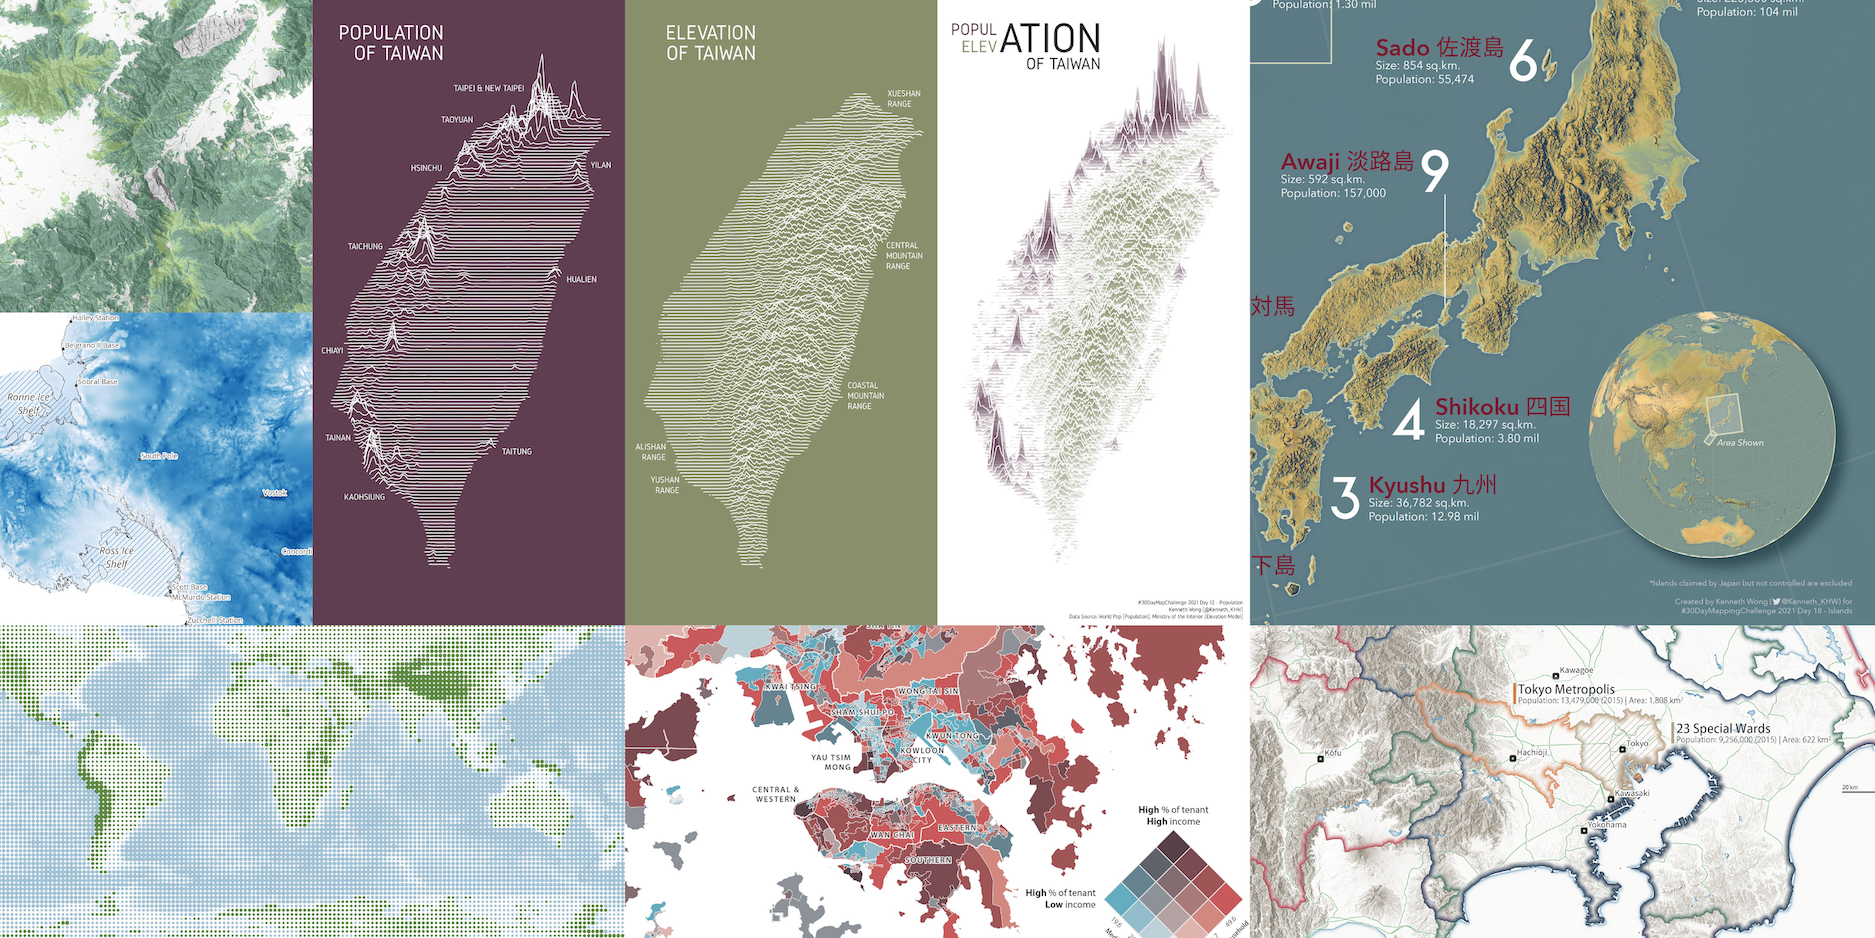
While they could not be formally categorised as a complete project, it will not harm to put them into a single place. Here is a curated set of maps and charts I personally love.
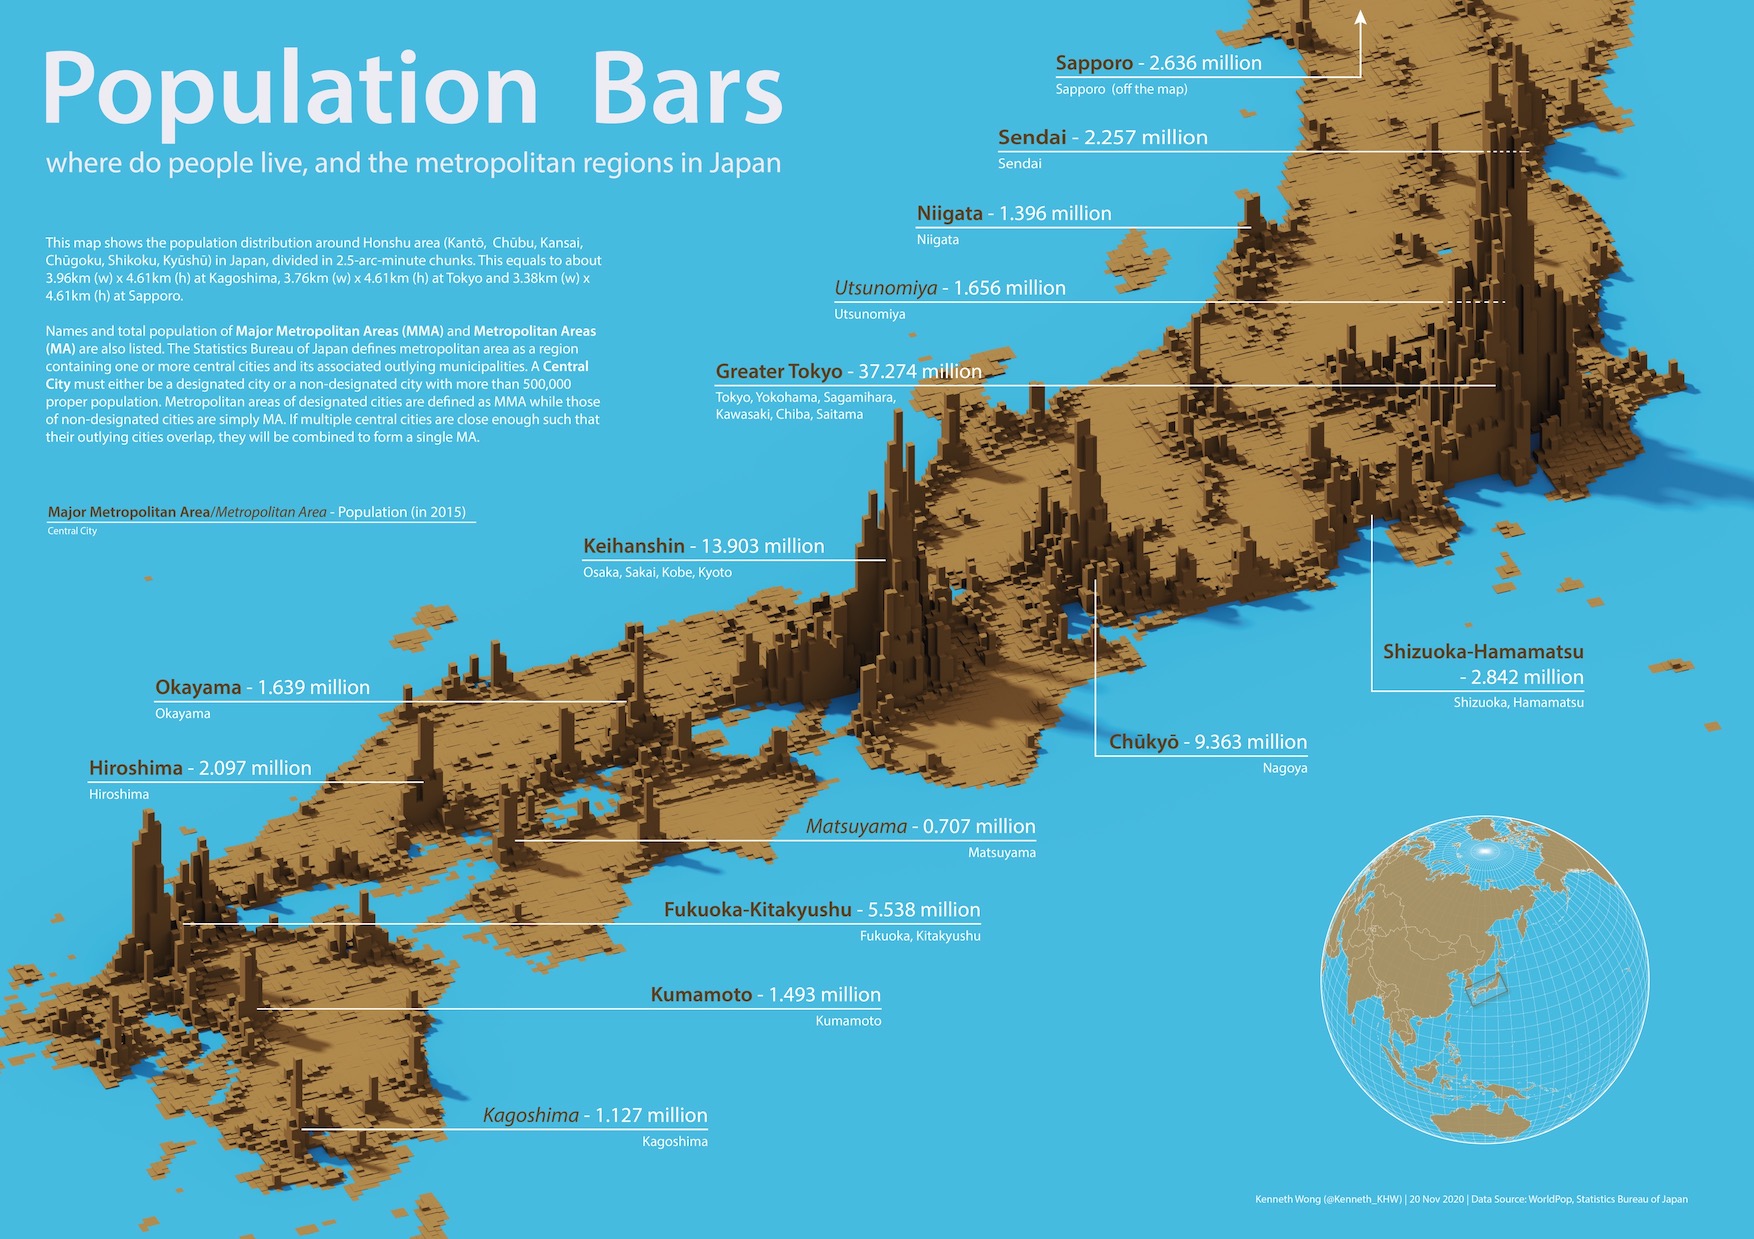
Population of Japan
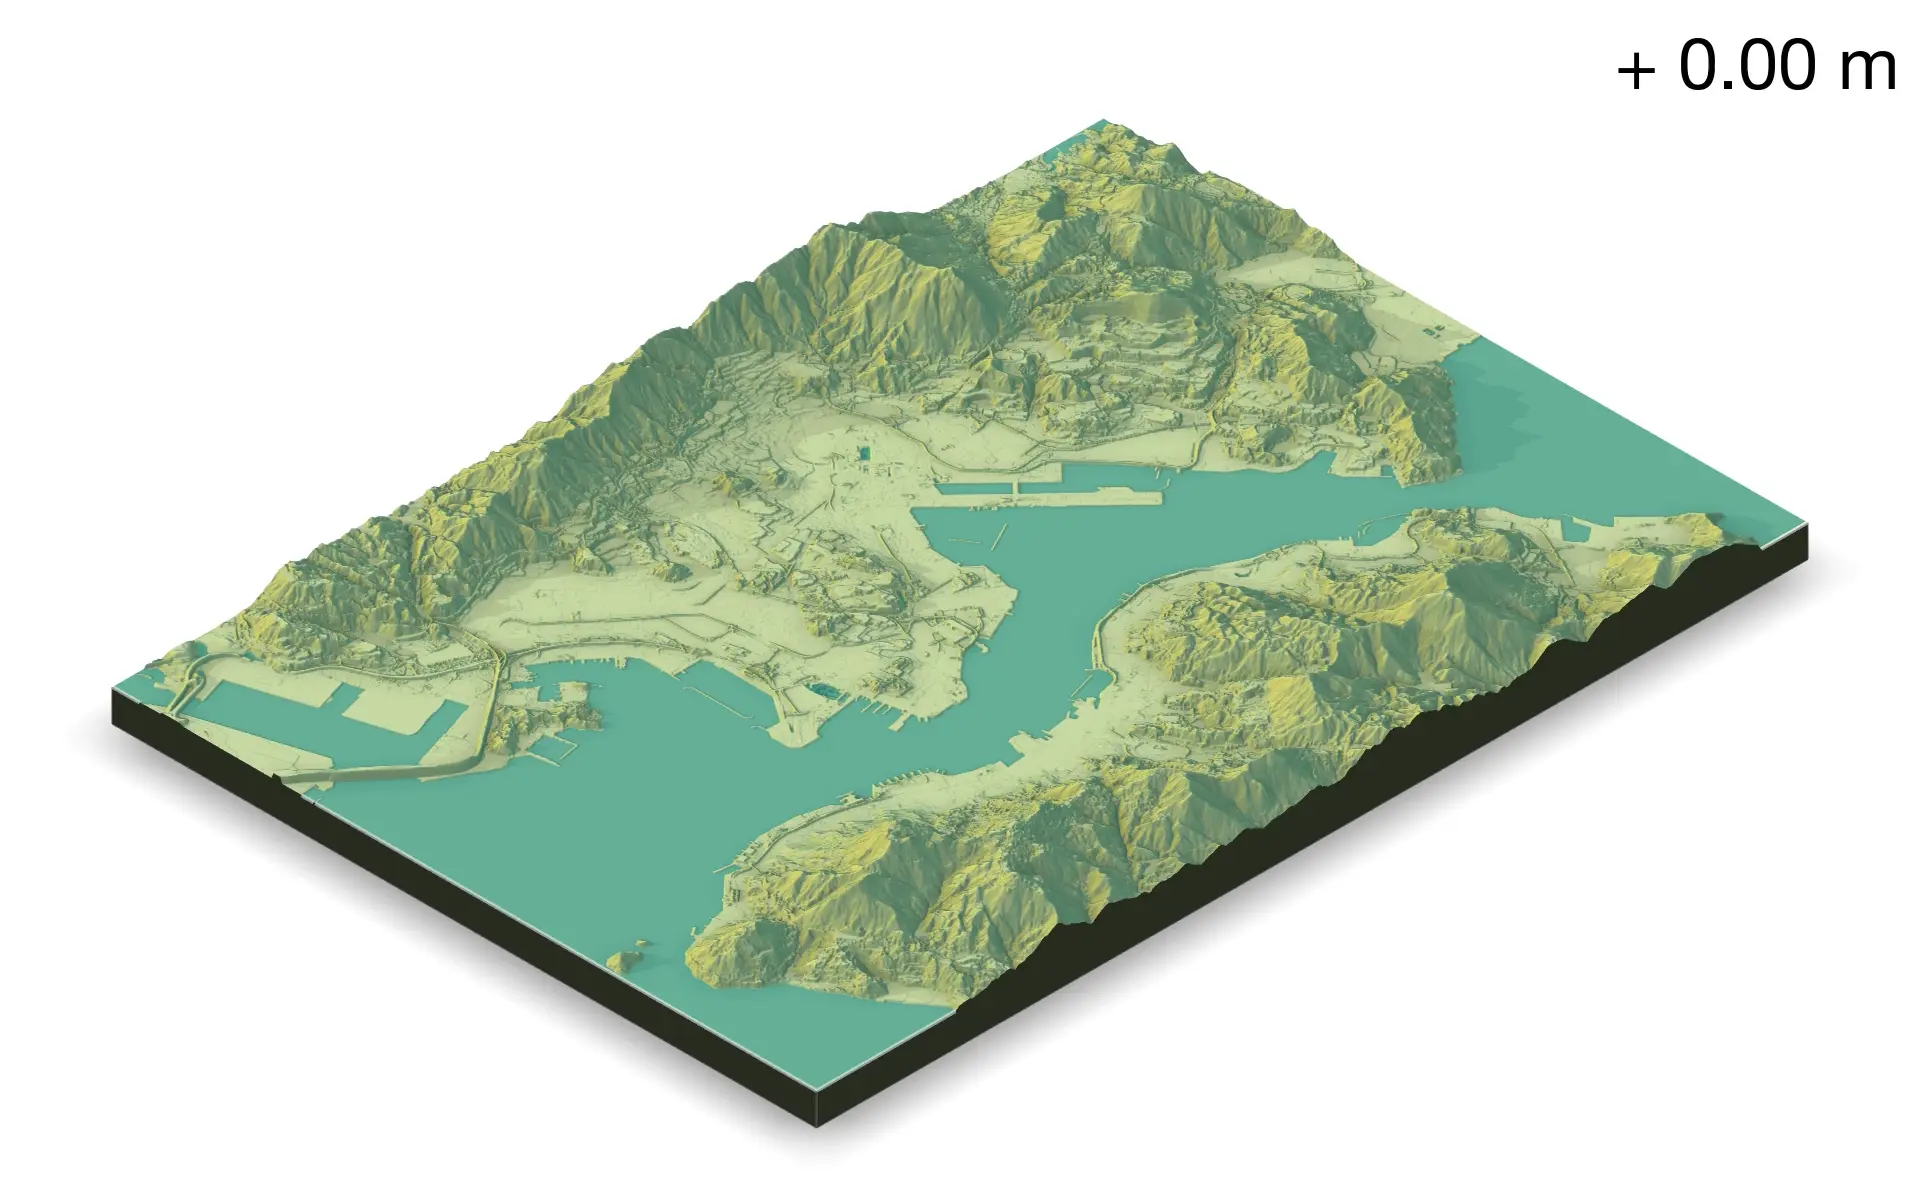
Animation showing the flooded area of Hong Kong when sea level rises to 5 m above current sea level
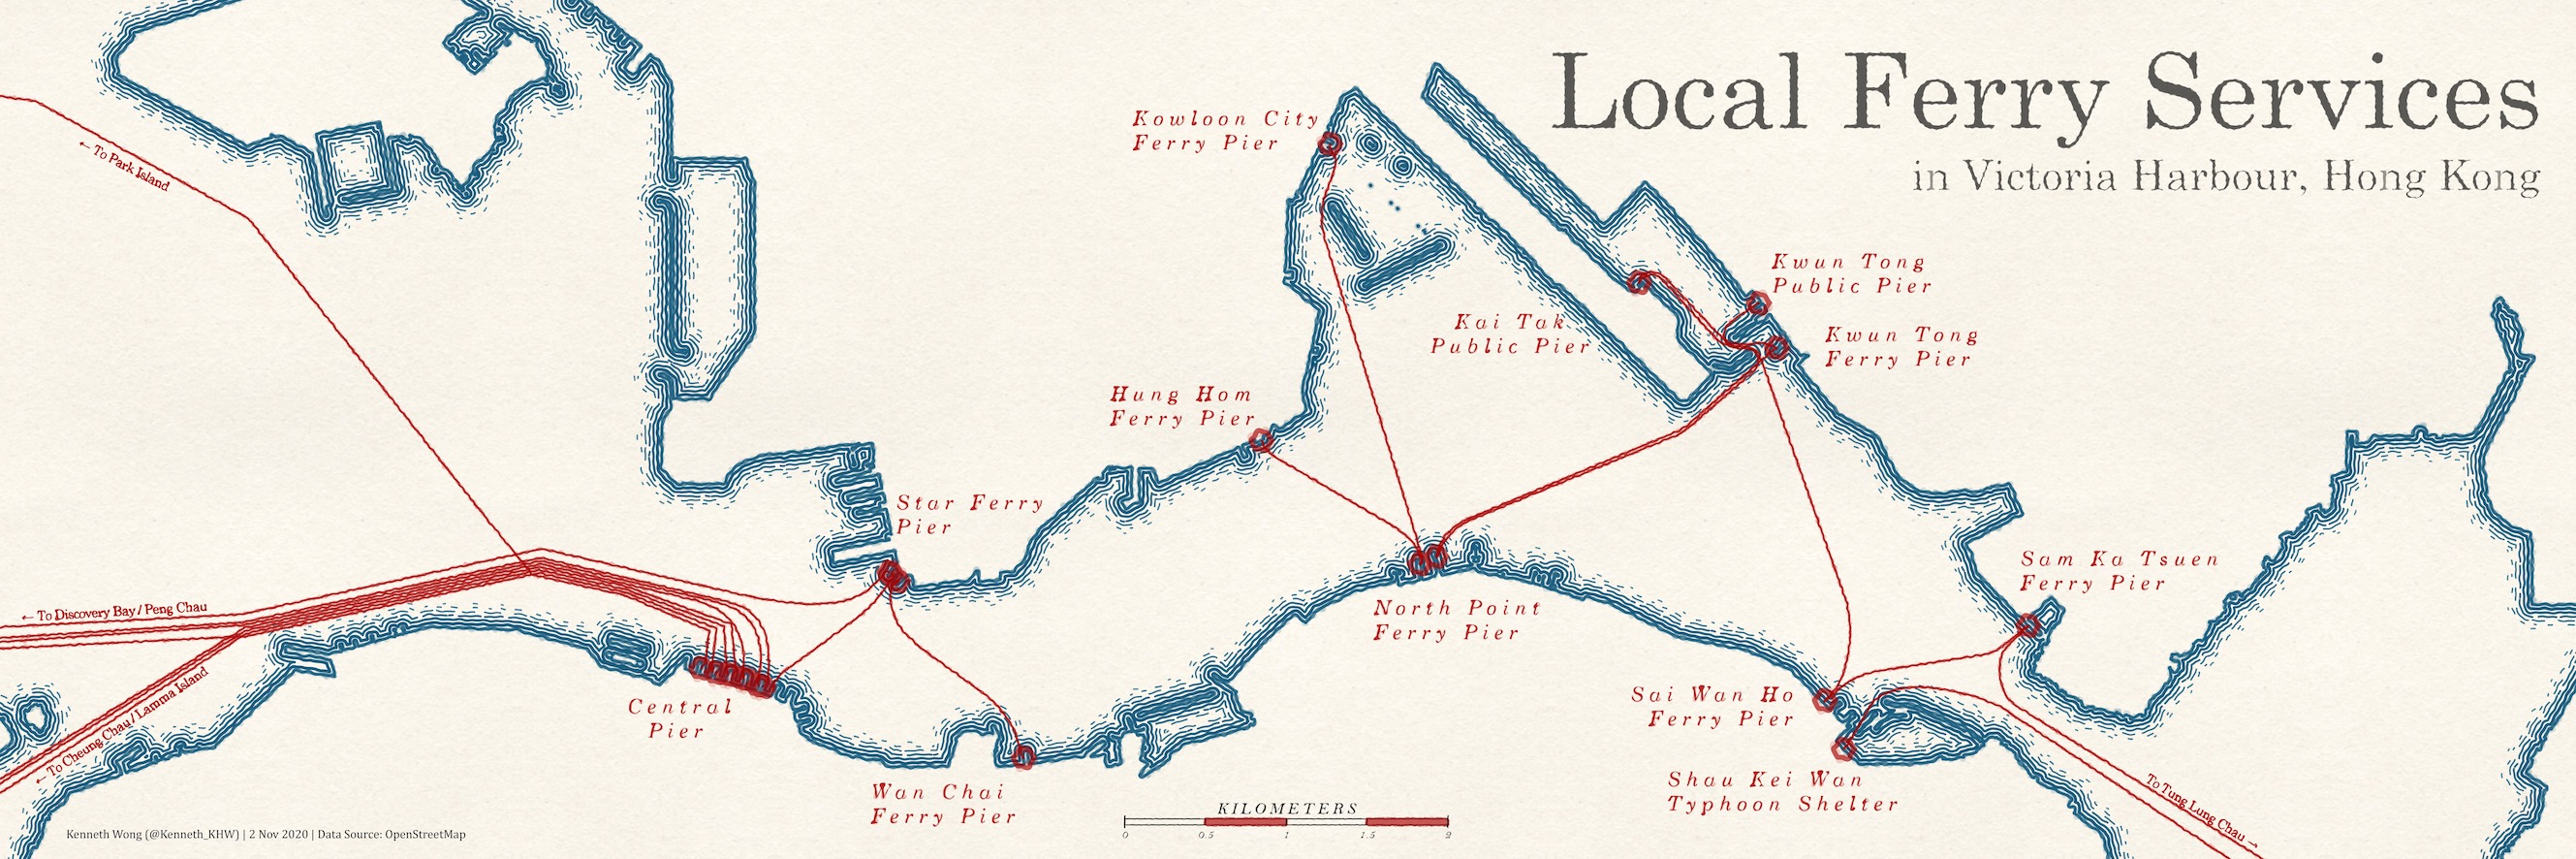
Ferry routes in Victoria Harbour
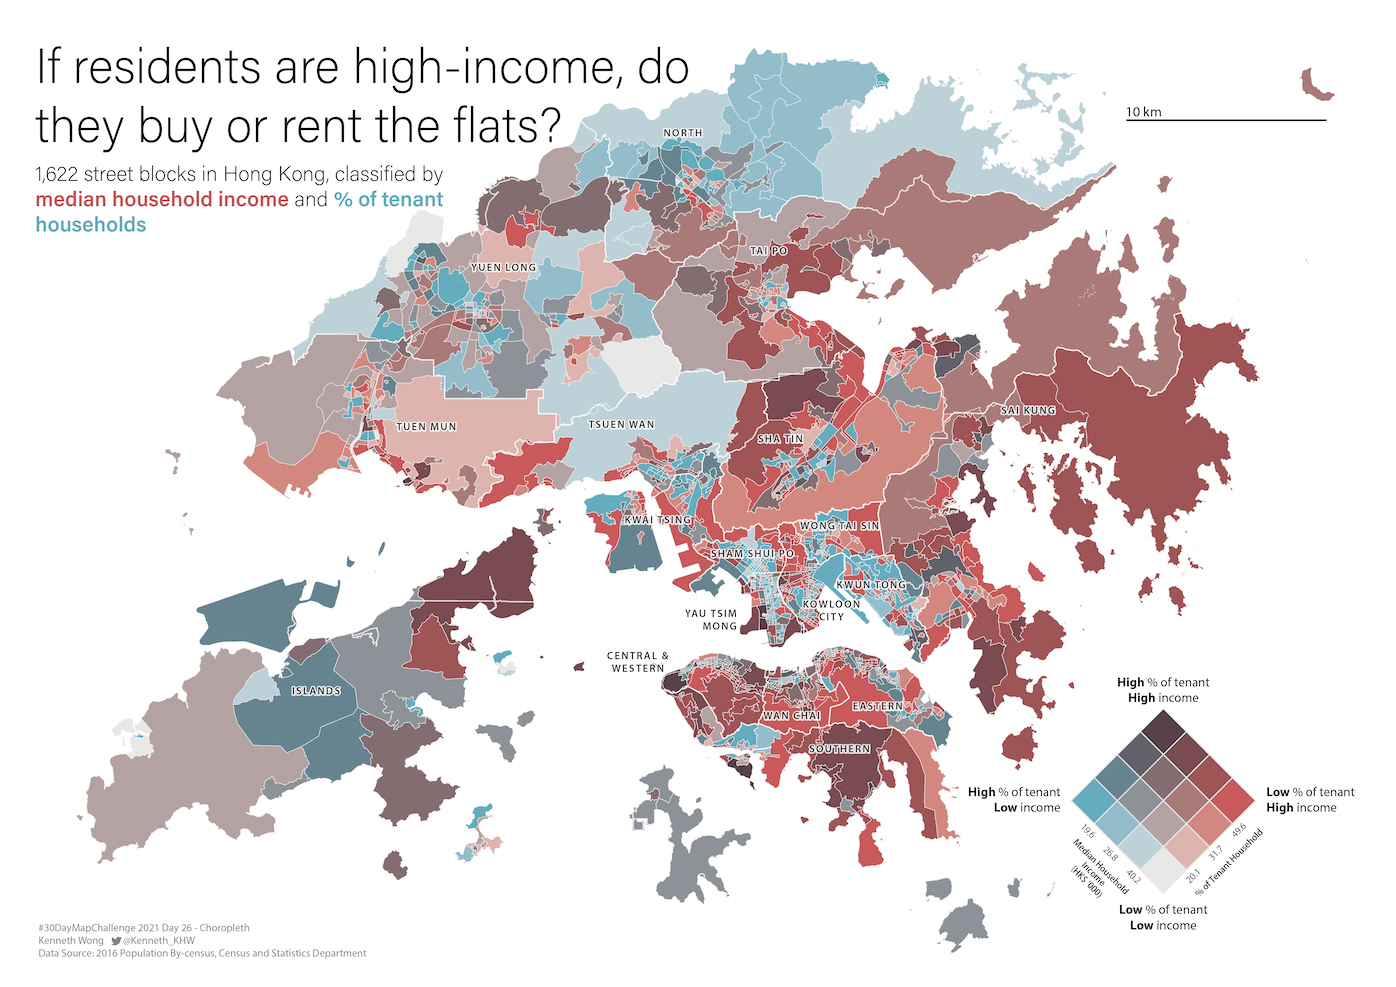
Bivarite map of income comparing household income and % of tenant household of street blocks in Hong Kong
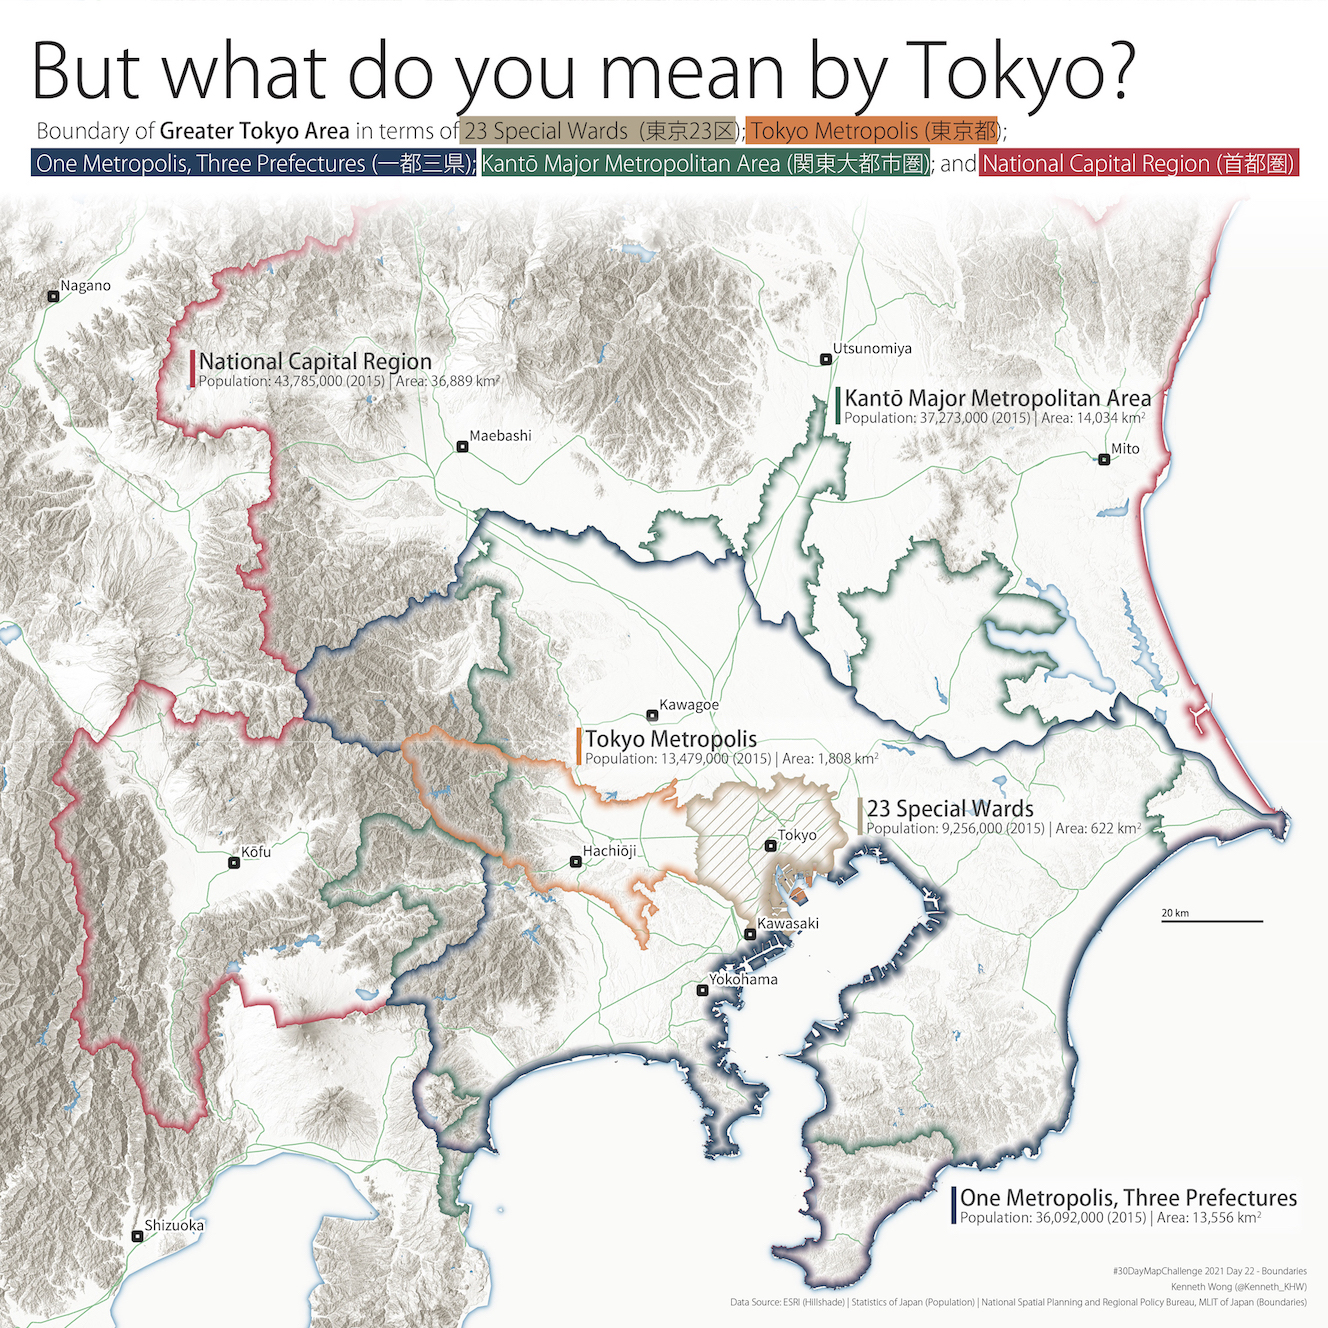
Mapping the boundaries of Tokyo using various definitions